This chart demonstrates the correlation between housing costs and wages for 20 states.
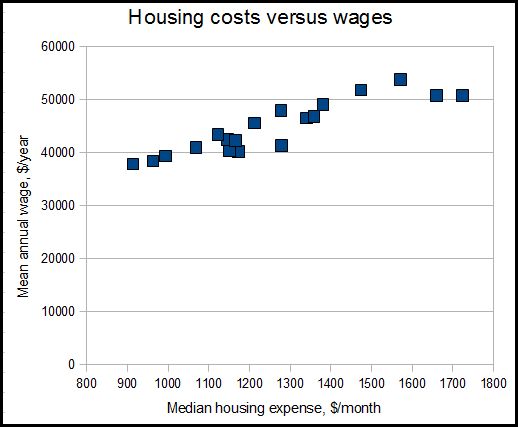
New Jersey and California have the highest costs, while Iowa has the lowest. Affordable housing keeps workers happy even if wages aren't the best. I think that California, New Jersey and New York could be doing much better if their housing became more affordable.
The next chart shows housing costs versus job growth over the last economic cycle. Very expensive and very cheap housing seems to be associated with low job growth

Which state is best?

California and Texas come out in the middle of the pack with a similar standard of living to each other. It is important to remember that there are huge differences in housing costs between different areas of California, so this might not apply to any specific Californian city.
Washington state does extremely well. My jobs model doesn't work at all for Washington state. It is an anomaly in many ways, and I don't know why.
Iowa has the lowest wages of any of the states listed, but makes up for it with very cheap housing. Utah workers work cheap, and Utah has one of the best job growth rates of any state.
The bottom line here is that affordable housing keeps wages down and living standards high.
( Important Data Note: For housing cost I'm using the median selected monthly owner cost from 2003 (Table 957) from the 2006 Statistical Abstract published by the Census Bureau. Based on a review of the Case-Shiller indices, current housing prices are close to 2003 levels in most areas. However, Nevada, Minnesota and Michigan are significantly cheaper today than in 2003. Except for those states, the cost I use should be within $2500 of the cost in 2011. These owner costs include mortgage, property taxes and utilities.
The web based paycheck calculator I used is PaycheckCity)
No comments:
Post a Comment