Friday, September 23, 2016

Which American President produced the best growth in incomes?

To answer this I will plot the change in real median personal income for each President's time in office. I'm plotting the fractional change in income from the year before the president entered office.  A fractional change of 1.2 corresponds to 20% income growth since that president entered the White House.


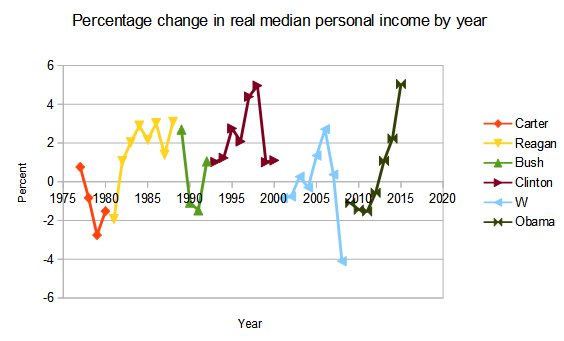
The winner here is Bill Clinton, with Ronald Reagan a strong second.  This chart clearly shows that some Presidential terms are much better for workers than others.  Obama's performance was very poor in his first term, and he is going to finish well behind Reagan and Clinton.

Below I show the same data displayed in a different way. Real income growth in 2015 was the strongest in the past 40 years. Another few years of that kind of performance would be very helpful for American society.


How do modern Presidents compare with those from the 1950s and 60s like Eisenhower, Kennedy and Johnson? The real median personal income data only goes back to 1976, so I went looking for another income data series. The best I found was real compensation per hour for the non-farm business sector.  The deterioration in performance from the era of Eisenhower to modern times is really quite shocking. There is a big step down in growth after 1970 and another one after 2008.


This measure shows that President Obama has had the worst growth in real hourly compensation of any President since at least 1953. Real hourly compensation data looks worse for Obama than real median personal income. Hourly compensation is linked to wages, while personal income includes investment income and other income sources as well as wages.


Notes and data sources

1/ All data is from FRED. I am using the non-seasonally adjusted Real Median Personal Income in the United States    series set to show percent change from a year ago.  I get non-farm real hourly compensation from here.

2/ 'W' is George W Bush who was President from 2001 to 2008. 'Bush1' is the first President Bush who served from 1989 to 1992.

3/ Carter served from 1977 to 1980. Reagan served from 1981 to 1988.

4/ 'Real' income shows growth in purchasing power after inflation is taken into account. 'Median' income is more relevant to the middle class than average income, which is increased by rising incomes among high earners. 


Saturday, August 20, 2016

Some pictures from the John Muir Trail in Yosemite National Park


Last week I hiked a short section of the John Muir Trail in Yosemite National Park. These pictures are from the Lyell Canyon area south of Tuolumne Meadows.


This area is within a few hours of the road, so no overnight camping is required.


Wednesday, August 10, 2016

A relationship between inflation and growth in wages and employment for the US economy

Some folks are speculating that the US economy is approaching full employment. In this post I'm going to explain why I don't believe that is so. I'm going to describe a Phillips curve like relationship between the core rate of inflation, wage growth and job growth. This is something of a work in progress. It seems to work well for the US economy, and a very similar approach appears to work for the UK, but I have not applied it to other economies yet.

On the y-axis I will plot the percentage growth in the product of wages and employment. For example, for January 1965 wage growth is 3.2% and employment growth is 3.6%. The quantity (wages*employment) grows by a 7% and this I plot on the y-axis.

The US economy seems to take time to respond to changes in employment and wages. On the  x-axis I will plot core inflation delayed by 21 months. For example, for the January 1965 data point I use the inflation from October 1966.


The best fit line shown on the chart predicts 2.2% inflation in October 2017 based on current rates of wage and job growth.  The growth in (wages*employment) is currently 4.4%, and it has never gone above 7% since 1992. In that time inflation has stayed under 3%.

Under what circumstances should we be concerned about a return of inflation? When inflation took off in the late 1960s the  growth of (wages*employment) was a little over 8%. From 1972 until 1981 it never fell below 7%. As long as it stays under 7%, inflation should stay low.

With growth in (wages*employment) at 4.4% as of January 2016, there is clearly a lot of room for stimulating the economy. When we approach full employment, wage growth should rise substantially.


 Notes and data sources

1/ All data is from FRED. For wages I am using the  "Average hourly earnings of production and non-supervisory employees: Total Private (AHETPI) " The data is seasonally adjusted. For January of each year I take the percent change from the previous year.

2/ For employment I am using "All employees : total nonfarm payrolls (PAYEMS)" seasonally adjusted. For January of each year I take the percentage change from the previous year.

3/ For core inflation I am using "Consumer Price Index for All Urban Consumers: All Items Less Food and Energy (CPILFESL)" I take the annual rate of change delayed by 21 months. For example, (earnings growth * employment growth) for January 1965 is plotted against inflation for October 1966.

4/ Care needs to be taken with the arithmetic. For example, wage growth of 3.2% is a factor of 1.032. Employment growth of 3.6% is a factor of 1.036. Earnings growth * employment growth = 1.032*1.036 = 1.069 which is equivalent to 6.9%.